Urban Data Analytics, Visualization, and Storytelling
Welcome to the Urban Data Analytics, Visualization, and Storytelling online textbook, written and created by the School of Cities at the University of Toronto. It is a combination of learning materials on data analytics, data visualization, and narrative techniques to make complex urban trends understandable and engaging for specific audiences, such as policymakers, funders, or community members.
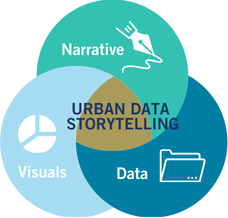
There are three core modules, each composed of several chapters and hands-on tutorials.
Urban data storytelling: Craft compelling narratives about cities, in order to communicate research and key insights, inform policy-making, build public will, or advocate for change.
Urban data analysis: Find, process, and analyze data via Python, spreadsheet software, and GIS aimed at deriving key findings and answering research questions.
Urban data visualization: Learn a variety of strategies, methods, and practical tips for effective visual communication of urban data via a range of maps and charts.
This is a living textbook, we will be updating and adding new sections to it in the near future.
The entirety of this textbook lives on GitHub.
How to use this textbook
This online textbook can be read in full, or you can select different sections depending on what you want to learn or do.
| What do you want to learn or do? | Textbook section |
|---|---|
| Urban Data Storytelling | |
| - How can I start creating a “data story”? - What are the overall steps involved and what should I be thinking about as I do this work? |
Introduction to urban data storytelling |
| - How do I create narratives that bring people together around shared values? - What are different types of stories I can tell with data? - How do I shift from highlighting problems to showcasing community assets? |
Creating shared ground through data storytelling |
| - How do I critically evaluate data sources and their limitations? - What questions should I ask before using any dataset? - How do I avoid common pitfalls in data interpretation? |
Data literacy |
| - How can I use data ethically and responsibly? - How do I center equity and justice in my data work? - What are the potential harms of data analysis and how do I avoid them? |
Data ethics and equity |
| - What are common biases in analysis and presentation of data? - How do structural factors affect data? |
Subjectivity and objectivity in data |
| - How do I effectively present data visualizations to different audiences? - What are best practices for using data in PowerPoint presentations? - How do I make my data presentations engaging and persuasive? |
Communicating data in presentations |
| Urban Data Analytics | |
| - Where can I find relevant data sources? - Now that I’ve found the right data, how do I understand its format? - What tools should I use to analyze my data? - How do I get help when struggling with coding or analysis? |
Introduction to urban data |
| - Which variables should I analyze? - What should the geographic level of my analysis be? |
Measuring the city: metrics and indicators |
| - What is coding, and how can I use it to analyze my data? - What is Python, and how do I use it? |
Programming with Python and computational notebooks |
| - How do I do basic analysis of my data in Python or Excel? - For example, how do I remove unnecessary information from my dataset or rename some variables? |
Processing and analyzing data |
| - How do I understand the structure of my data and relationships among variables? - In other words, how can I examine some basic statistics? |
Statistical foundations |
| - How do I examine large and complex datasets with multiple variables of interest? -What tools can I use to do this? |
Advanced statistics and multivariate methods |
| - I want to create a map but I don’t understand how to get the right data for it - what do I do? - What is spatial data? - What is GIS (geographic information systems) and how do I use it? |
Spatial data and GIS |
| - How do I explore, analyze or manipulate spatial data by coding in Python? | Spatial data in Python |
| - How do I do something to my spatial data, like create a buffer or find the intersection of two polygons? - How do I convert a list of addresses into points that can be mapped? |
Spatial data processing |
| - What is OpenStreetMap (the Wikipedia of maps and spatial data) and how can I get data from it? | OpenStreetMap |
| - How do I download data from the Canadian census? | Overview of Canadian census data |
| - How do I download data from the U.S. census? | Overview of U.S. census data |
| - How do I store, query, or analyze geographic data within a database system? | Introduction to spatial databases |
| - How do I manage and interact with databases using SQL? | SQL fundamentals |
| - How do I manage and interact with spatial databases? | Spatial databases and PostGIS |
| - How do I access a spatial database using Python? | Accessing PostGIS with Python |
| Urban Data Visualization | |
| - Why should I visualize data and what makes visualizations effective? - What are the key components and theory behind data visualization? |
Introduction to visualization |
| - What are practical tips for creating clear and effective data visualizations? - How do I improve the design and accessibility of my charts and maps? |
Ten practical tips for effective data visualization |
| - How do I create some basic plots to explore my data in Python? | Exploratory data visualization |
| - What kinds of maps can I make? - What are the different elements of an effective map? |
Maps and visualizing spatial data |
| - How do I make a map that shows… | |
| …different colors for different values? | Choropleth maps |
| …different colors for two different values at once? | Bivariate choropleth maps |
| …symbols whose sizes correspond to some value? | Proportional symbol maps |
| …lines representing travel between locations? | Flow maps |
| …dots whose colors represent some value? | Categorical dot maps |
| …density and concentration patterns? | Visualizing and mapping density |
| - How do I make an interactive online map? | Web map development |
Contributors and citing
This online textbook was compiled using Quarto with content contributions from (in alphabetical order by last name) Jeff Allen, Karen Chapple, Isabeaux Graham, Julia Greenberg, Aniket Kali, Lindsey Smith, Evelyne St-Louis, Nate Wessel, and Michelle Zhang. Each page lists its authors.
If you want to cite this online textbook, here is the recommended citation:
Allen, J., Greenberg, J., St-Louis, E., Zhang, M., Kali, A., & Chapple, K. (Eds.). (2025). Urban Data Storytelling, Analytics, and Visualization. School of Cities, University of Toronto.
@book{allen2025urbandatastorytelling,
  editor    = {Allen, Jeff and Greenberg, Julia and St-Louis, Evelyne and Zhang, Michelle and Kali, Aniket and Chapple, Karen},
  title     = {Urban Data Storytelling, Analytics, and Visualization},
  year      = {2025},
  publisher = {School of Cities, University of Toronto},
  url       = {https://schoolofcities.github.io/urban-data-storytelling/}
  doi   = {https://doi.org/10.5281/zenodo.17912387}
}
If you want to cite a specific page, here is an example of a recommended citation:
Greenberg, J. & St-Louis, E. (2025). Exploratory data visualization. In Allen, J., Greenberg, J., St-Louis, E., Zhang, M., Kali, A., & Chapple, K. (Eds.), Urban Data Storytelling, Analytics, and Visualization. School of Cities, University of Toronto.
@incollection{greenberg2021dataviz,
  author    = {Greenberg, Julia and St-Louis, Evelyne},
  title     = {Exploratory data visualization},
  booktitle = {Urban Data Storytelling, Analytics, and Visualization},
  editor    = {Allen, Jeff and Greenberg, Julia and St-Louis, Evelyne and Zhang, Michelle and Kali, Aniket and Chapple, Karen},
  publisher = {School of Cities, University of Toronto},
  year      = {2025},
  url       = {https://schoolofcities.github.io/urban-data-storytelling/urban-data-visualization/exploratory-data-visualization/exploratory-data-visualization.html}
  doi   = {https://doi.org/10.5281/zenodo.17912387}
}
License
This online textbook and its notebooks are licensed under Creative Commons Attribution-NonCommercial-ShareAlike 4.0 International Public License.
You are free to:
- Share — copy and redistribute the material in any medium or format
- Adapt — remix, transform, and build upon the material
Under the following terms:
- Attribution — You must give appropriate credit, provide a link to the license, and indicate if changes were made.
- NonCommercial — You may not use the material for commercial purposes.
- ShareAlike — If you remix, transform, or build upon the material, you must distribute your contributions under the same license as the original.