On creating this arc diagram of Line 1 daily trips
~ Jeff Allen, 02/2026
Last March (2025), I created a diagram for Line 2 showing trip patterns during an average morning commute. Since making it, I have received several requests to make a similar arc diagram for Line 1. I originally thought doing so would be a bit of a challenge, since the geometry for Line 1 is not a (mostly) straight line like Line 2 – it is more like a warped 'U' or an elongated semi-circle looping from Vaughan down to Union and then up to North York.

But I found that by unfurling the geometry of Line 1, then plotting flows of trips between stations using a similar arc diagram approach, I could still still show a few interesting trends.

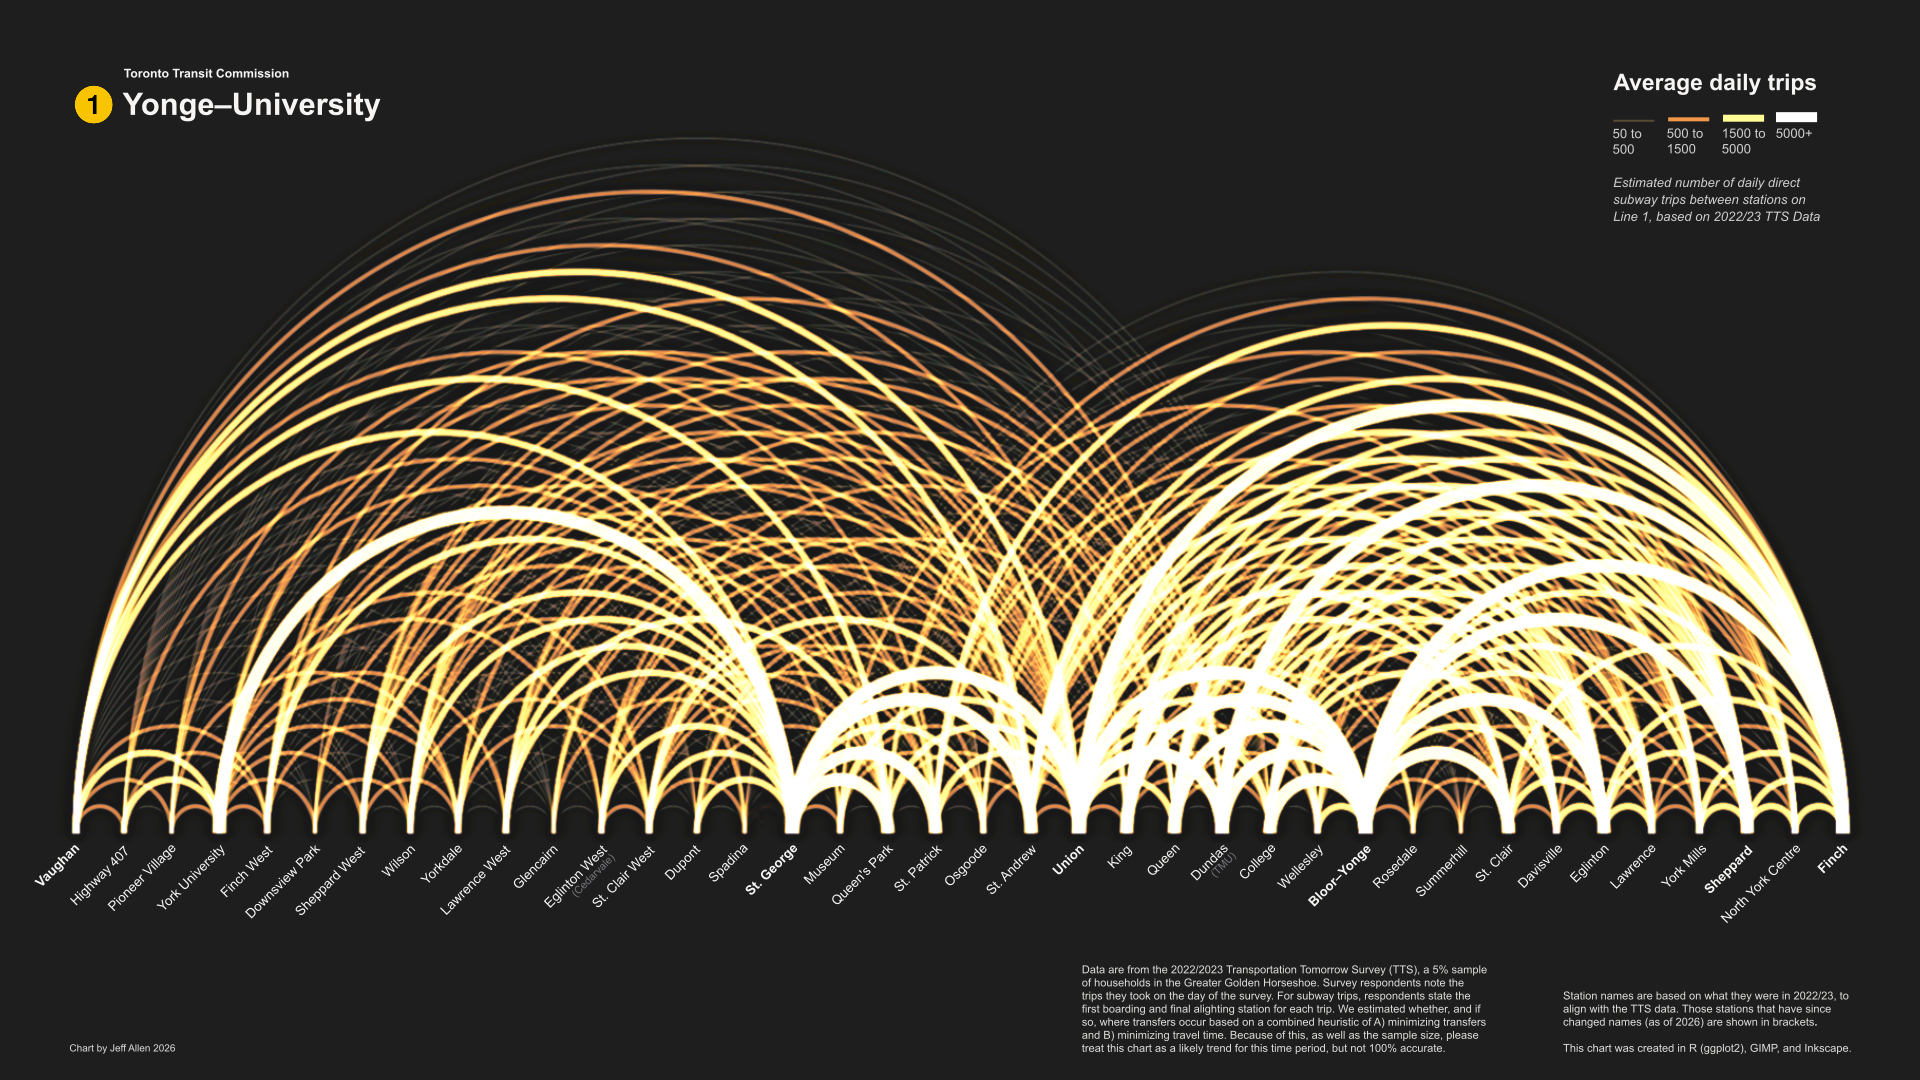
At a more granular level, the arc diagram above shows which pairs of stations see the most trips, and which pairs have very few between them. Dundas (now TMU) to/from Bloor–Yonge was the station pair with the greatest number of trips.
At a more regional level, the diagram shows two distinct domes (or mountains) of arcs, one for the more well-travelled, eastern, Yonge section and one for the longer, western, University section. This dual pattern highlights how Line 1, based on trip data like this, is used more like two lines that share an overlapping section (stations south of Bloor).

Specifically, data for this arc diagram are from the Transportation Tomorrow Survey (TTS). Survey respondents note the trips they took on the day of the survey. For subway trips, respondents state the first boarding and final alighting station for each trip. The TTS is approximately a 5% sample of households, so while not comprehensive, it does provide a good overview of travel patterns. The survey was conducted in two parts, one in Fall 2022 and another in Spring 2023, which were both used in this diagram.
However, one issue with the TTS is that it only notes the start or end station of a subway trip, but not any intermediate transfer stations. So, for trips that start or end on other lines (e.g. Lines 2 or 4), I inferred the Line 1 leg based on the most likely transfer point. For example, if your trip started at Kipling on Line 2 and ended at Davisville on Line 1, I assumed that your most likely transfer to Line 1 was at Bloor–Yonge (adding to the total of trips between Bloor–Yonge and Davisville shown on the diagram), rather than at St. George or Spadina.
This can get a bit arbitrary in some situations. For example, say you are travelling from Dupont to College (both on Line 1); would you stay on Line 1 the entire way, or would you transfer at St. George, ride Line 2 to Yonge, then transfer back south on Line 1? My assumption here is that for any trip starting north of Bloor and ending south of Bloor, you would not transfer; but for any trip starting north of St. George and ending north of Bloor–Yonge you would transfer on Line 2 between St. George and Bloor–Yonge rather than travelling the full loop. Trip that start and end on opposite segments north of Bloor only account for ~1.4% of all trips, so even if my assumptions were strengthened with better data, the overall patterns on the arc diagram would not change a lot.
So, due to the sample size and some assumptions about transferring, this chart can be interpreted as the likely trend for this time period, but not as 100% accurate.
That's it for now! If you have any questions, comments, or suggestions, please feel free to reach out to me at jeff.allen@utoronto.ca