Accessory dwelling units (ADUs) are often seen as ‘the low-hanging fruit’ in addressing the housing crisis, but they are not materializing across all Toronto neighbourhoods. Some have witnessed substantial ADU growth, while others have little or none. We analyzed ADU permits issued between 2022 and 2025 in Toronto neighbourhoods, and found that that growth is highly concentrated and related to local housing and household characteristics.
As the name suggests, ADUs are dwelling units that exist as accessory to the primary residence on a residential lot. ADUs promise to deliver more housing stock at lower cost than units in new apartment complexes without radically changing the built character of a neighbourhood, hence the term ‘gentle density.’ Additionally, ADUs offer homeowners an opportunity to monetise their asset by converting parts of their property into dwellings for rent. These characteristics make ADUs a win-win for everyone, especially considering the dual post-pandemic crises of the cost of living and housing unaffordability in Canada.
Legislation permitting ADUs picked up steam in Toronto in 2017, following earlier adopters like California.
Permit activity picked up steadily during the period we analyzed, from 375 issued permits in 2022 to 550 issued in 2025, continuing a pre-pandemic trend.
In total, there were 1,894 ADU active (i.e. in progress) and completed permits issued between 2022 and 2025.
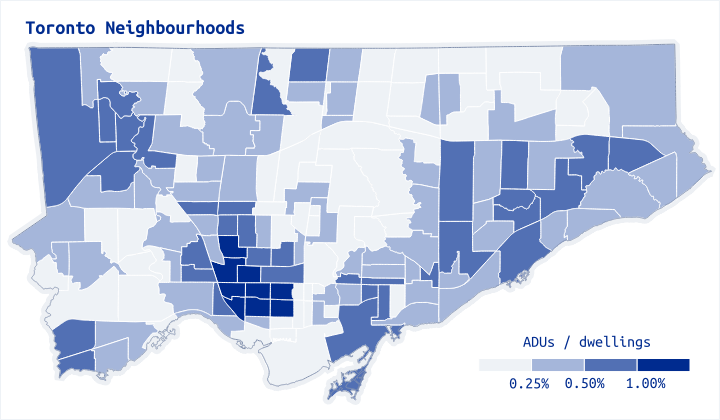
However, they reveal clustering in some areas, with the densest cluster just west of downtown Toronto.
What might explain clustering of ADU activity across Toronto? And which neighbourhood-level factors appear most closely associated with higher ADU rates?
To explore this, we calculated a proportion of ADU permits to all eligible dwellings (single-detached, semi-detached, row houses, and duplexes) for each neighbourhood in Toronto.
We then compared this proportion to a set of neighbourhood-level accessibility, housing stock, and demographic indicators. Specifically, we inputted these characteristics into ordinary least squares regression models to see which, all else being equal, are related to higher or lower rates of ADUs in neighbourhoods.
Through these models, we found that a mix of housing types, older housing stock, and higher proportions of single-parent households are related to ADU rates. More younger dependents were associated with lower ADU rates.
Via a spatial lag model, we also found that ADU rates were positively associated with ADU rates in surrounding neighbourhoods are controlled. For more information and for the technical details of this data, modelling, and results, check out this GitHub repository.
In summary, we found that neighbourhoods with high ADU rates are also neighbourhoods that have:
- Higher proportions of single-detached and duplex homes.
- Higher proportions of homes built before 1960.
- Lower proportions of young dependents.
- Higher proportions of single-parent households.
- Higher ADU rates in surrounding neighbourhoods.
The models suggest that ADU activity in the surrounding neighbourhoods has a strong influence on a neighbourhood’s ADU rates. This means the growth of ADUs in Toronto could be due to diffusion, learning-by-seeing, or other unmeasured-but-spatially-patterned factors. This is a phenomenon seen in other cities like Portland, where the availability of information (and even tours) about ADUs led to an explosion of new construction in certain areas.
Further research might help to understand whether these patterns reflect the limited familiarity in Toronto of homeowners, builders and/or planners with ADU projects. This is likely the case when looking at detached ADUs. Prior to 2022, such ADUs had to be adjacent to laneways, which are more common in older neighbourhoods located closer to downtown (thus the monicker 'laneway suite'). After 2022, that restriction was removed and detached ADUs could be built anywhere on the same lot (thus the additional labels of ‘garden / rear-yard suite’). This should make detached ADUs possible even in newer neighbourhoods all over the city. However, the majority of backyard suites built in 2024 and 2025 are still adjacent to laneways, even though the majority of residential properties do not have laneway access.
Neighbourhoods of households with more young dependents have fewer ADUs, signalling either that these families lack the resources to build or that families without young children are better able to spare some living space for ADU conversions. Meanwhile, the promise of additional rental income from ADUs may explain the positive non-linear relationship between single parents and ADU rates.
These patterns differ from Californian cities, where it was found that many ADUs were concentrated in ‘diverse, transit-accessible neighbourhoods where… homeowners… still have a mortgage’ (e.g. the City of Los Angeles). In Toronto, concentrations of visible minorities or owners with mortgages were not significantly associated with ADU permitting rates. This suggests that there may be structural barriers that constrain the uptake of ADUs by homeowners, which is also a concern in California.
To an extent, the City of Toronto has worked to address some of the issues with low ADU take up in some neighbourhoods. As well as approving ADUs to up to six units on one lot, the City has also published pre-approved ADU plans that homeowners and builders could easily adopt, and has undertaken demonstration projects to showcase the models – both proven methods to increase uptake. However, in order to expand ADU permit activity across the city, it will be important to expand education efforts in Toronto neighbourhoods underserved by ADUs.


