People who live closer to a library tend to visit it more often, borrow more resources,
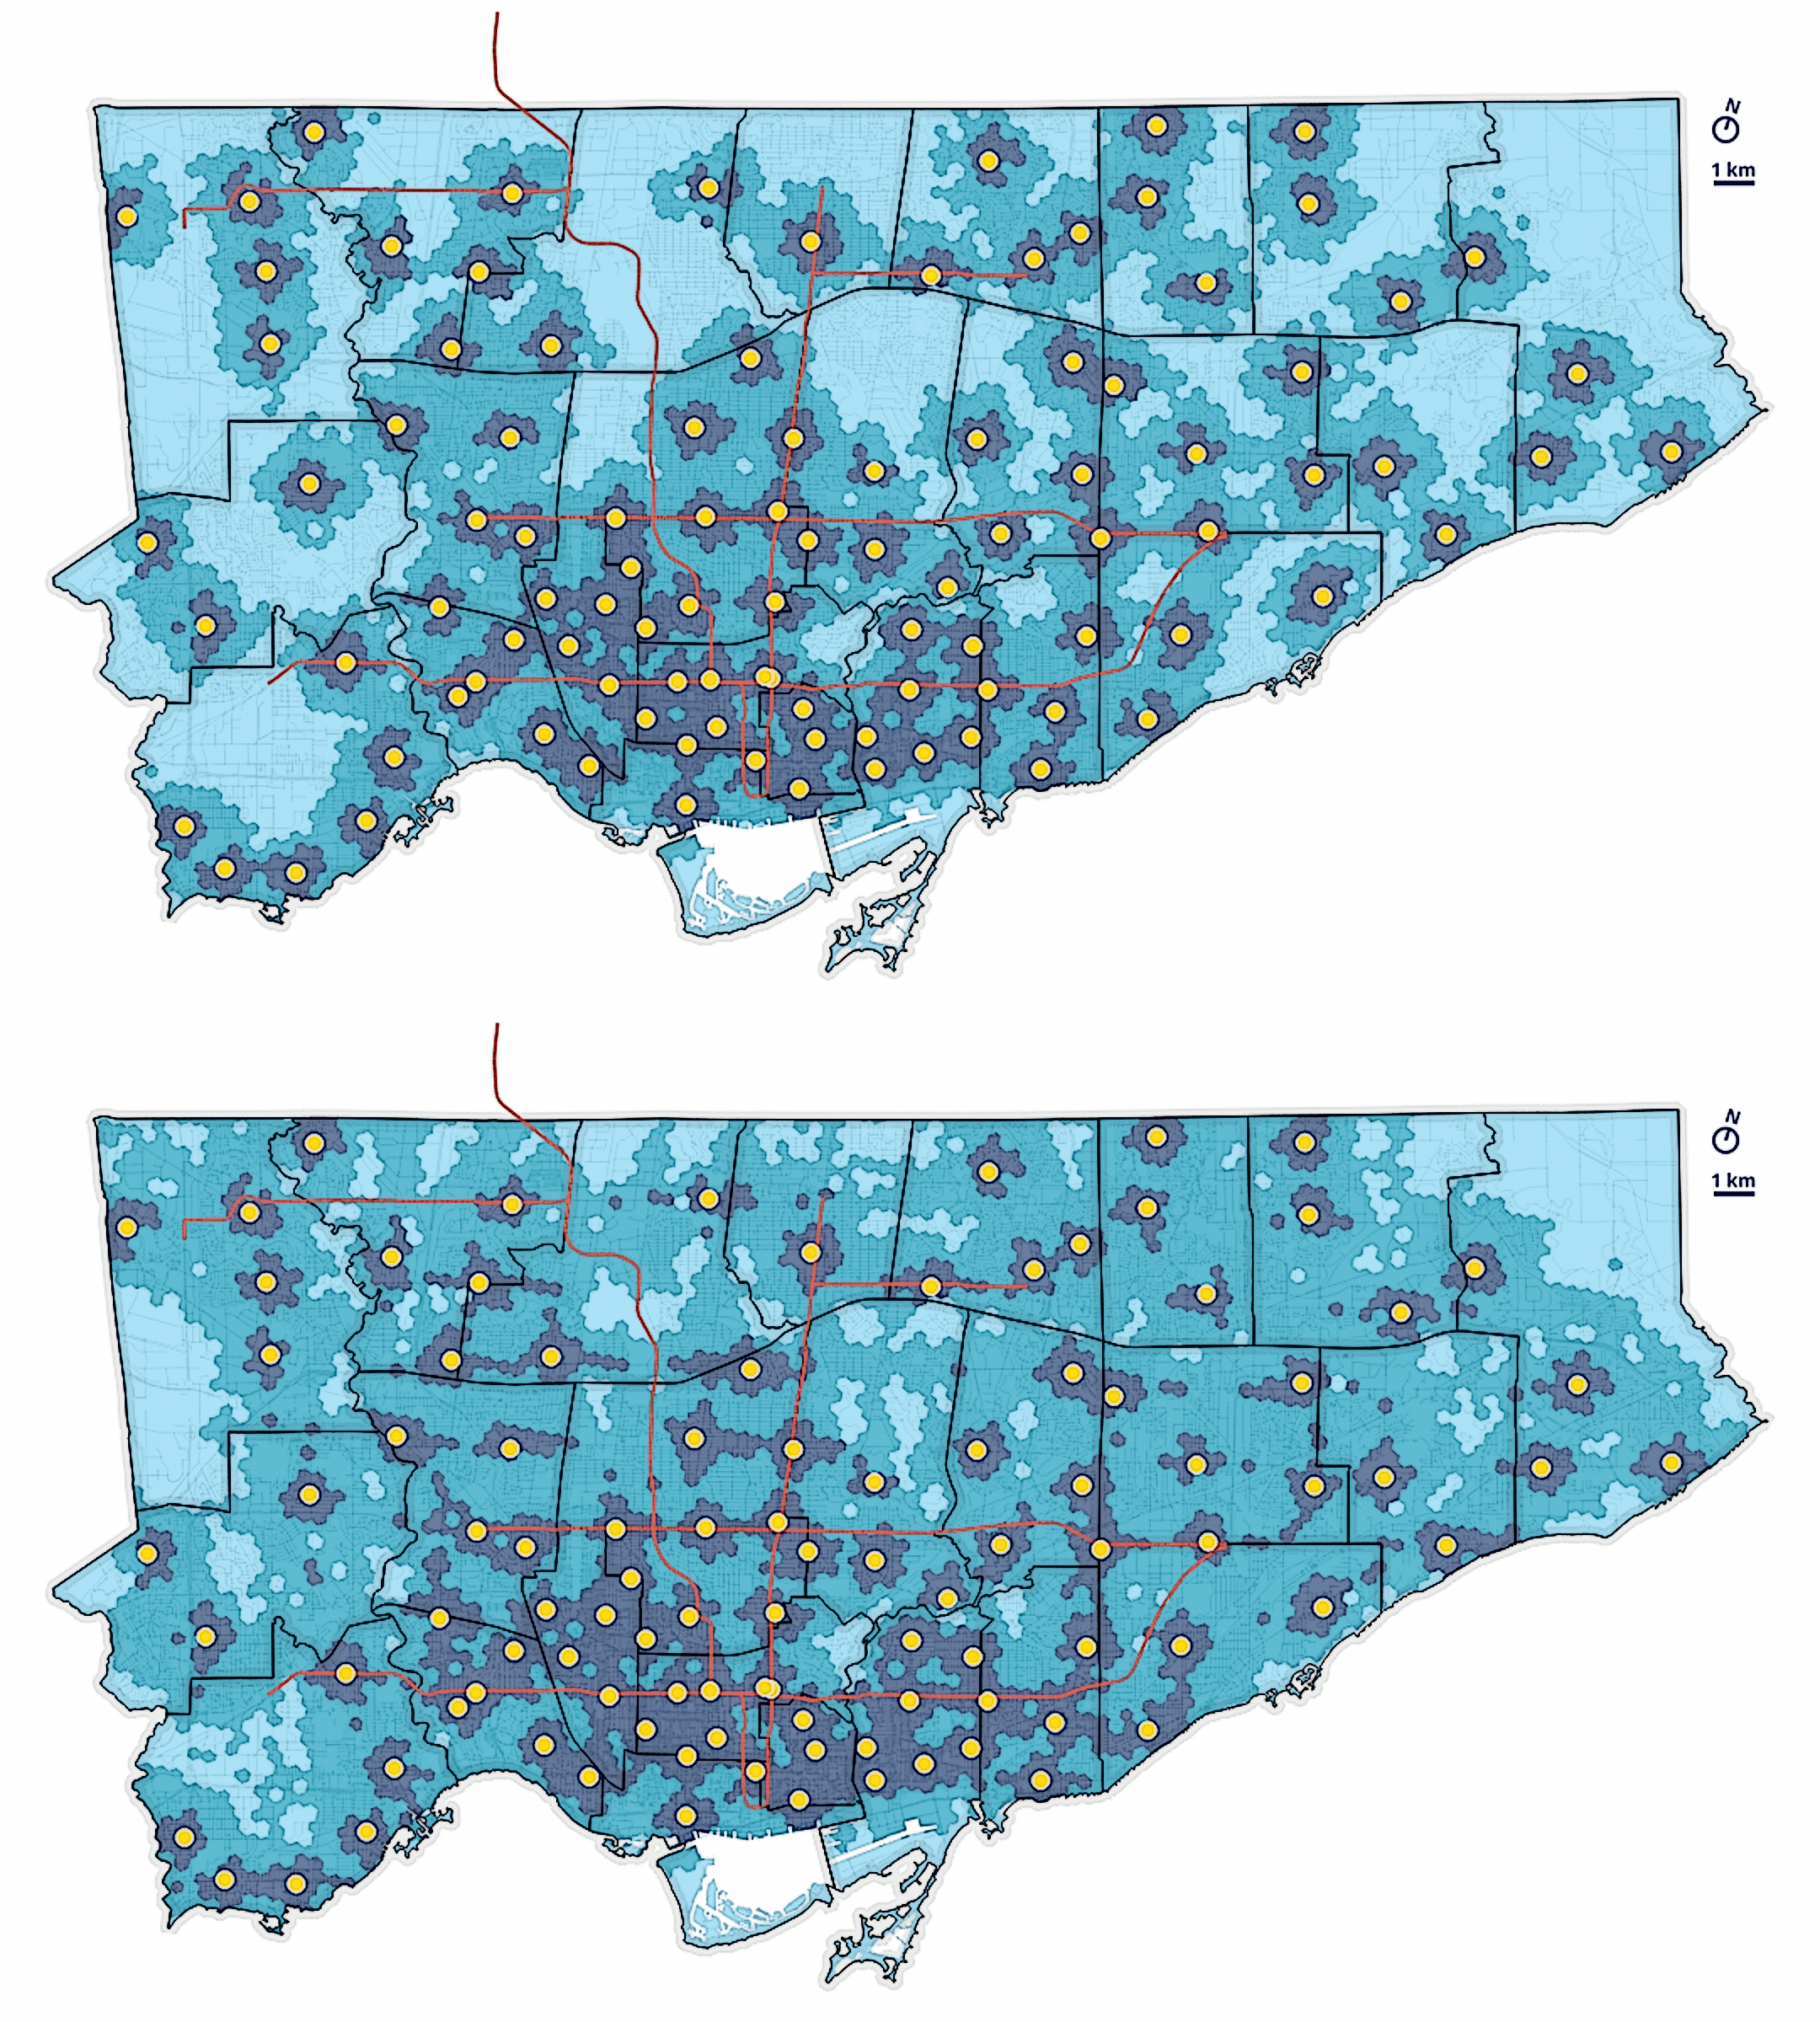
and access its social services more easily. We mapped how long it takes to reach the nearest public library from any location in Toronto, on foot, and by public transit.
On foot, 35% of Torontonians can reach the nearest library within 15 minutes and 79% within 30 minutes; by transit, those shares rise to about 40% and 95%. The areas least connected to libraries are inner-suburban neighbourhoods, which have fewer libraries and lower population density.
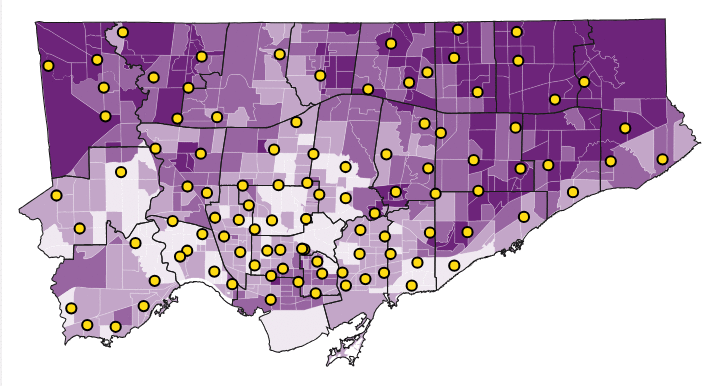
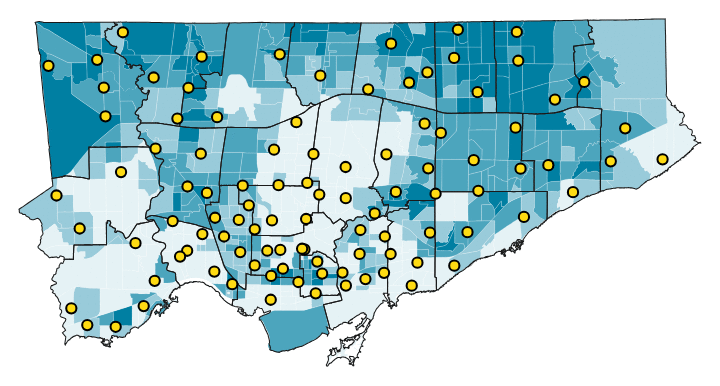
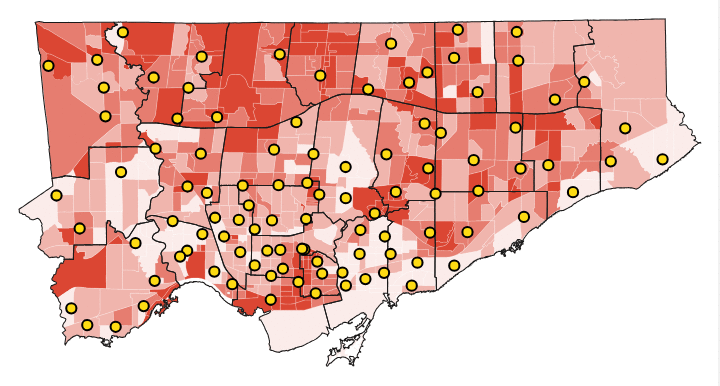
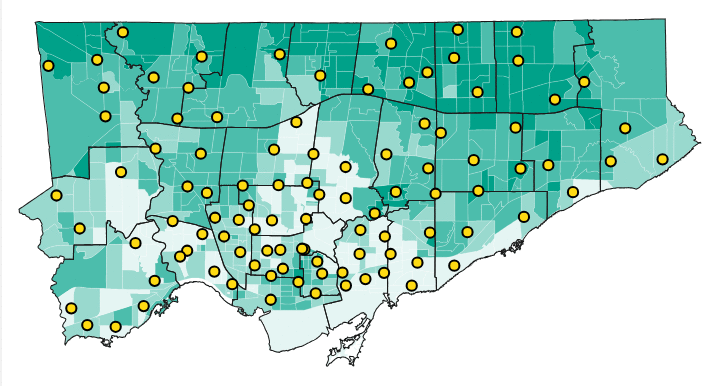
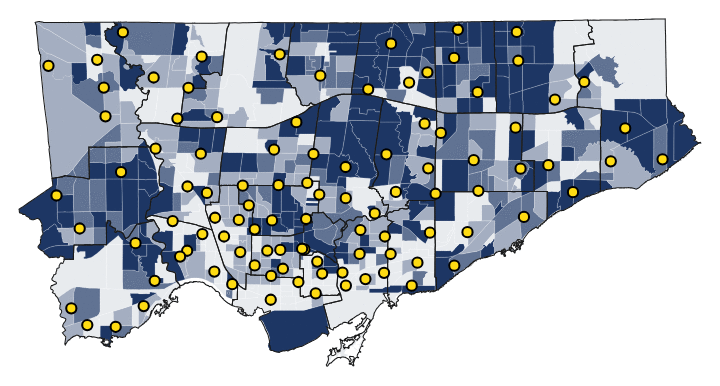
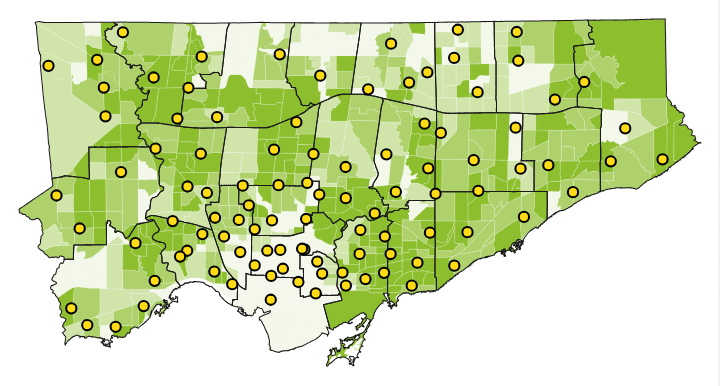
According to research conducted in other urban areas, accessibility to libraries varies across travel modes and population groups. With public libraries offering programming for such target populations as recent immigrants, youth, and seniors, it is crucial to account for differences in library access across demographic groups. Using census data, we mapped where these groups are concentrated across Toronto in relation to the locations of public libraries.
If you want to explore demographic data against the transit travel data, including at a more zoomed-in neighbourhood level, you can refer to our interactive tool.
Across every population group examined, travel time to the nearest library is close to the citywide median. Immigrants, low-income households, children, seniors, and visible minority residents all face slightly longer trips on average, but the gaps are small, 71 seconds at most. By transit, every group's median is within 45 seconds of the citywide median.
Methods and data
We overlaid a grid of 200-metre hexagons on Toronto and calculated the travel time from each hexagon to the nearest public library.
Travel times were computed with the r5py Python library, using OpenStreetMap's pedestrian network and TTC transit schedules, so they follow realistic routes rather than straight-line distance. We modelled two scenarios: walking only, and walking plus public transit. For transit, we computed the minimum travel time for a late-morning departure window on a Tuesday (a typical weekday) and on a Saturday. Because the weekday and Saturday results were very similar, the maps on this page combine them into a single transit measure. The separate Tuesday and Saturday isochrones can be explored on the interactive web map.
Demographic counts from each Dissemination Area (DA) are distributed onto the hexagon grid by area-weighted overlay (most DAs are larger than hexagons, so each DA's population is allocated to the hexagons it covers in proportion to overlap area). For each demographic group, we computed population-weighted means, medians, and percentiles of travel times. For the maps shown above, we used larger census tracts to help visualize neighbourhood differences (some DAs are quite small and would be illegible on maps of this scale, but DAs were more accurate for linking to the hexagon grid).
Data and code are in our GitHub repository.
Limitations
Travel times are computed from hexagon centroids, so results may be sensitive to the choice of grid size and placement. Additionally, we only measured travel time to Toronto Public Library (TPL) locations. It is possible that Torontonians near the city boundary have close access to a library in a neighbouring municipality, which could decrease the differences in travel times established in this project.
In terms of the demographic data, the 2021 Census was the most recent available at the time of writing, though population composition in some areas may have shifted since. Applying our methodology to the 2026 Census data will provide more up-to-date findings on the topic.
The analysis measures geographic accessibility based on transportation network datasets, not library services availability. The departure windows were chosen to fall within typical TPL operating hours on both a weekday and a Saturday, but individual branch hours vary and aren't accounted for. We also did not account for the types of services each location provides, and therefore the population groups it may attract. Filtering through libraries with programming catered to a specific group's needs could give a more nuanced insight into library services access for the target demographic groups.