Transit-Oriented Stadiums
How well are FIFA World Cup 2026 stadiums connected to their host cities by public transit?
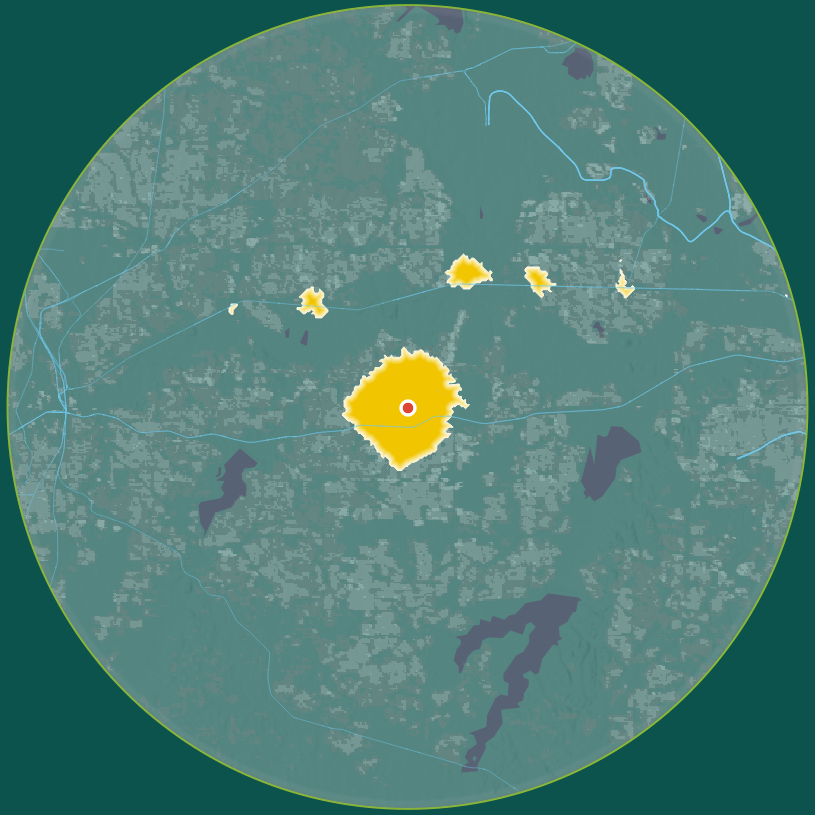
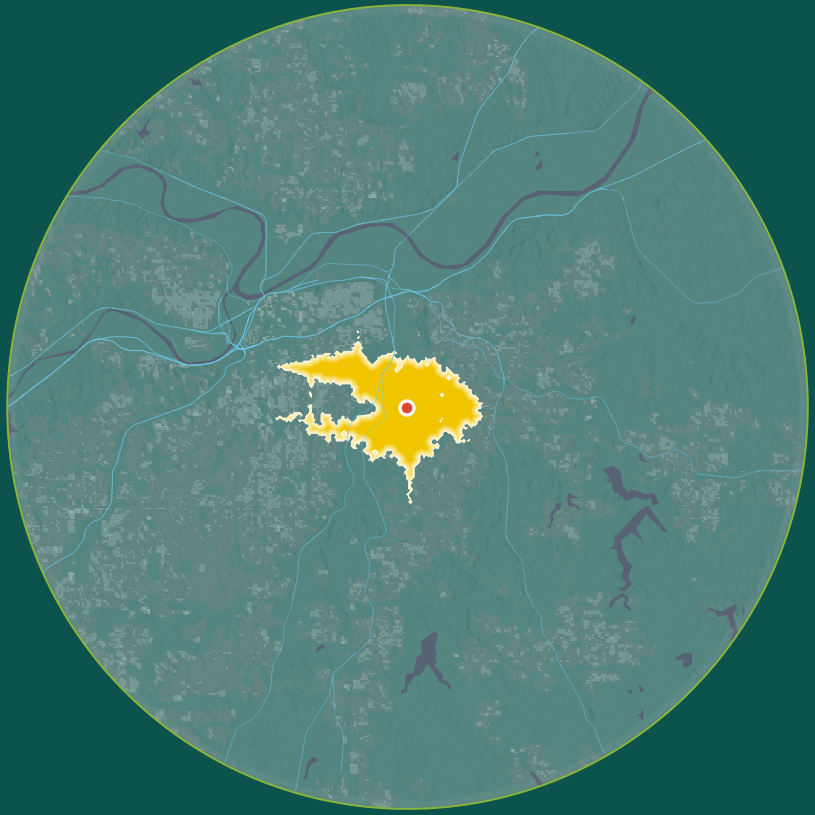
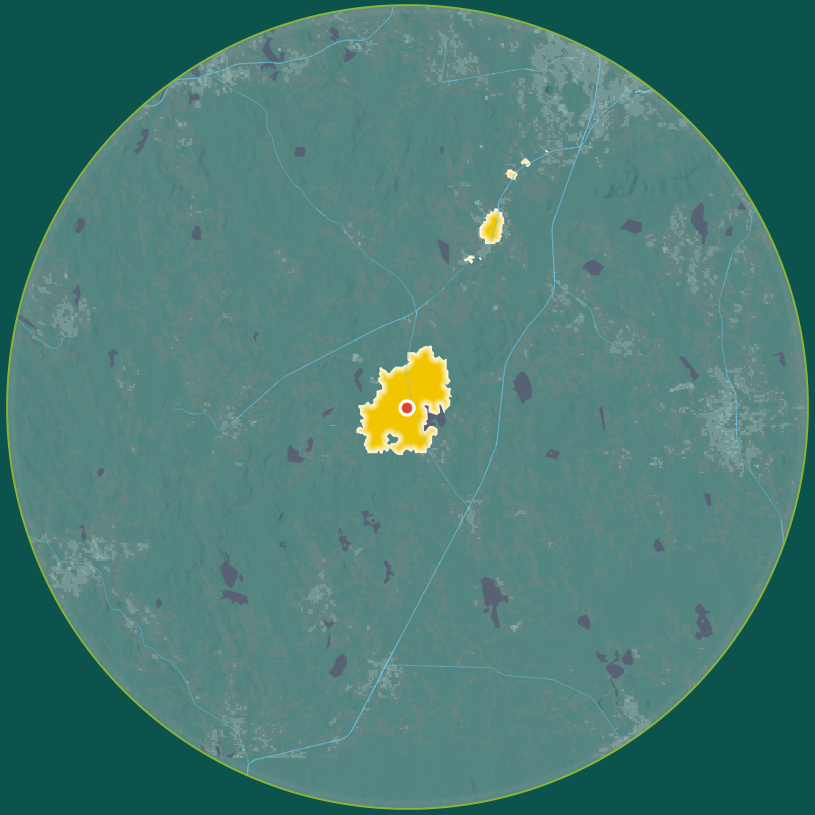
We mapped how far you can travel in 60 minutes by public transit around every stadium. Then we estimated how much of each metro's population lives within this area. The maps and data show that cities vary widely in how connected their stadiums are to the rest of the city via public transit.
BC Place Vancouver
(BC Place)
52,497 capacity
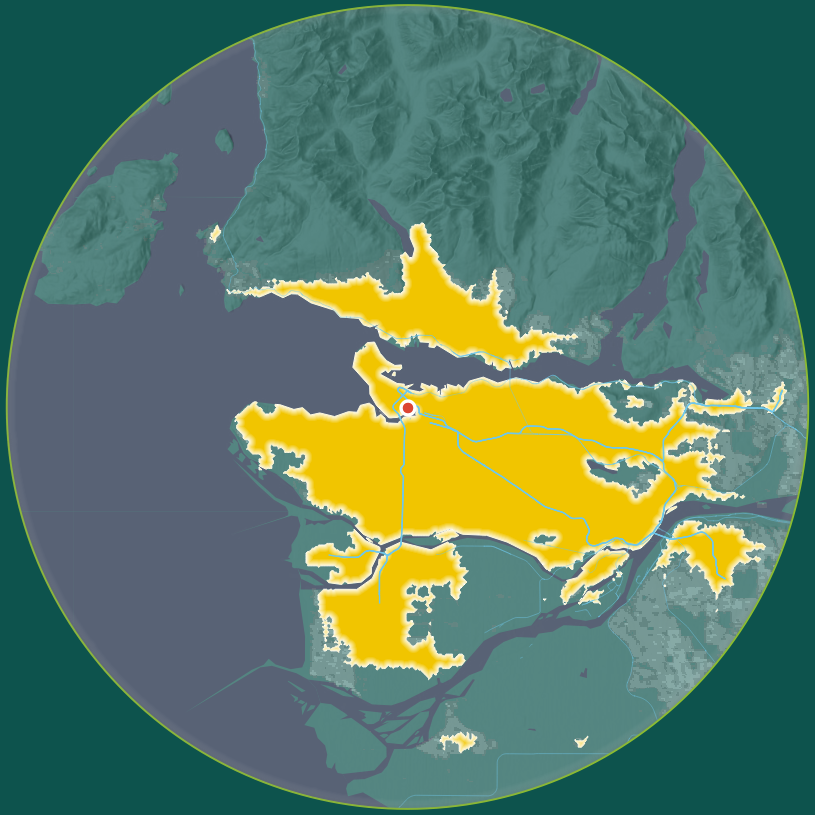
60-minute transit trip
within 25 km
Mexico City Stadium
(Estadio Azteca)
80,824 capacity
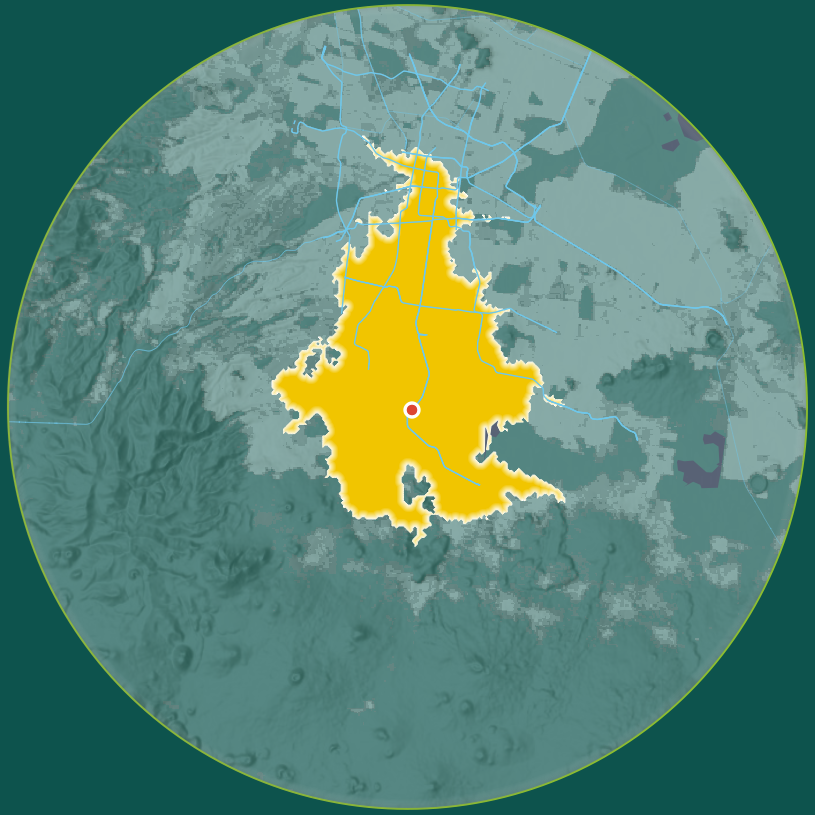
60-minute transit trip
within 25 km
Toronto Stadium
(BMO Field)
43,036 capacity
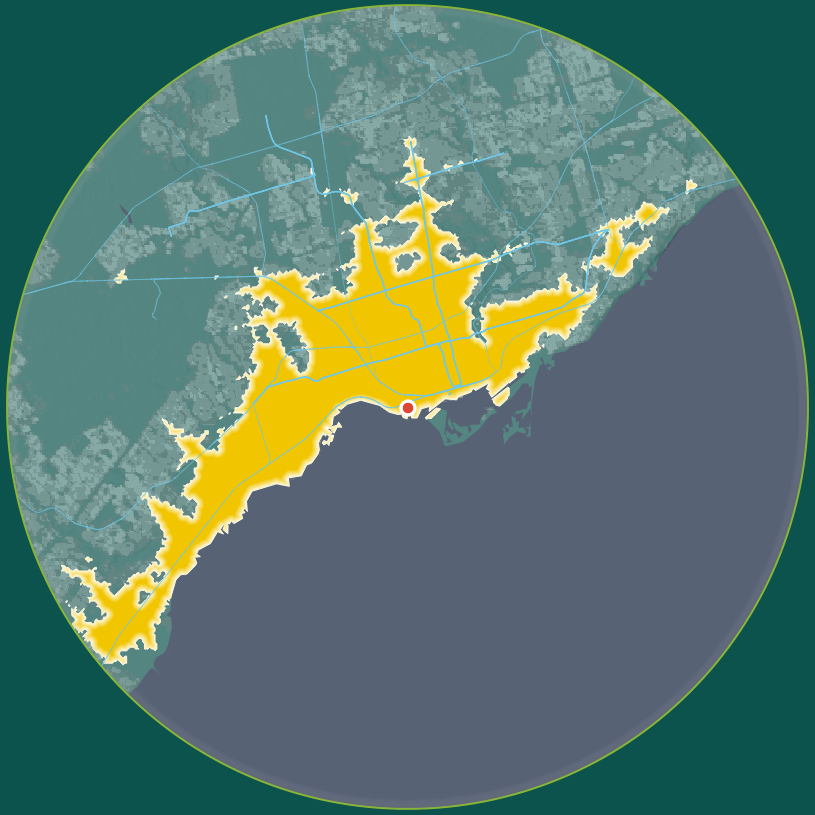
60-minute transit trip
within 25 km
Los Angeles Stadium
(SoFi Stadium)
70,492 capacity
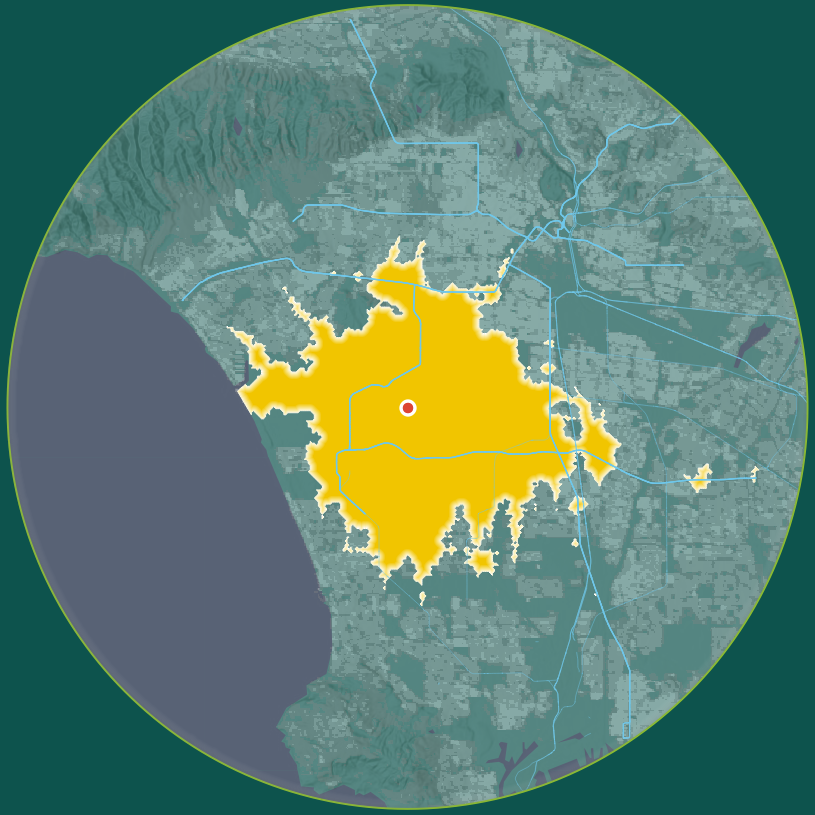
60-minute transit trip
within 25 km
New York New Jersey Stadium
(MetLife Stadium)
80,663 capacity
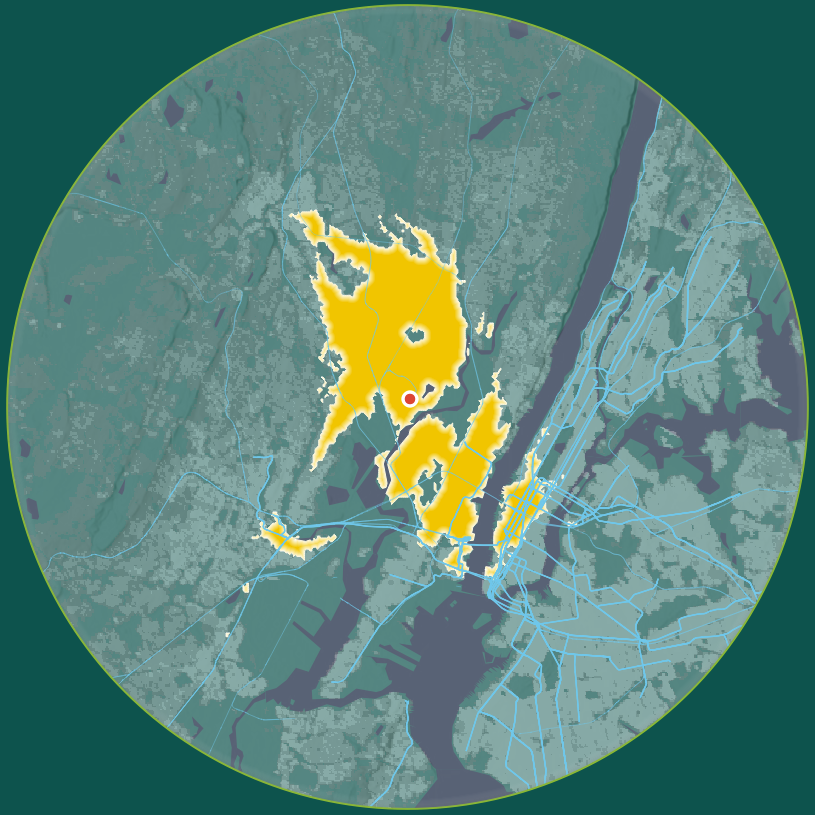
60-minute transit trip
within 25 km
Seattle Stadium
(Lumen Field)
66,925 capacity
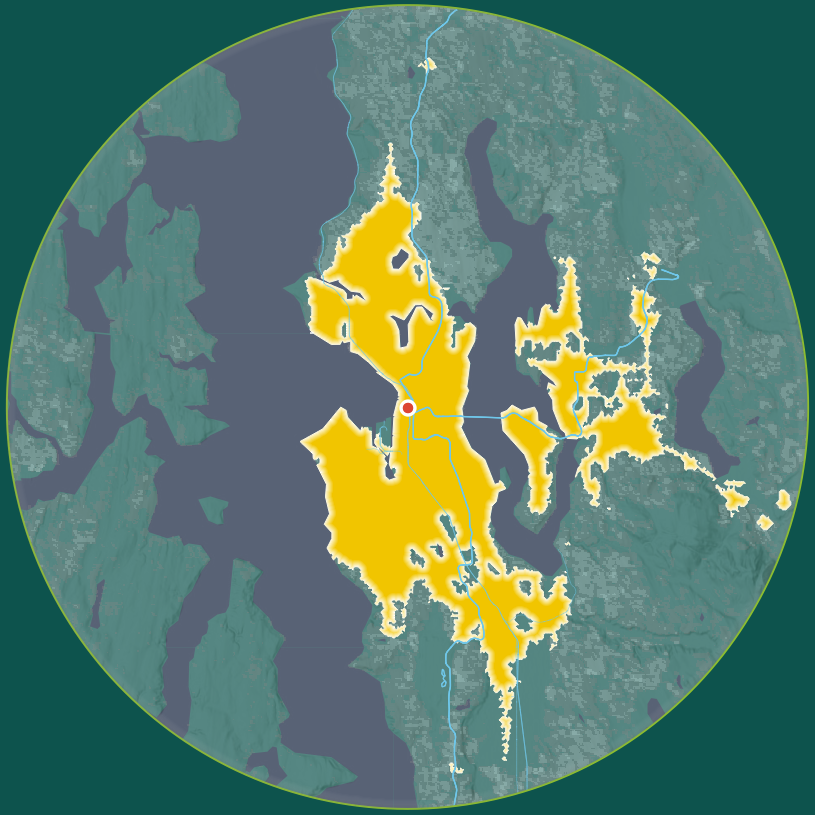
60-minute transit trip
within 25 km
Atlanta Stadium
(Mercedes-Benz Stadium)
68,239 capacity
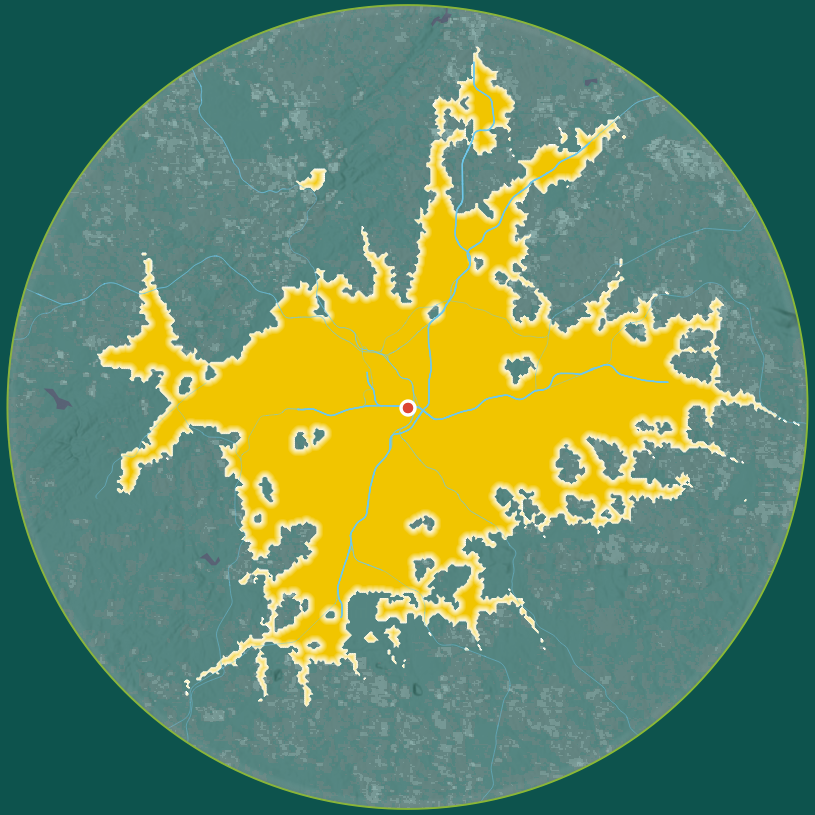
60-minute transit trip
within 25 km
Philadelphia Stadium
(Lincoln Financial Field)
68,324 capacity
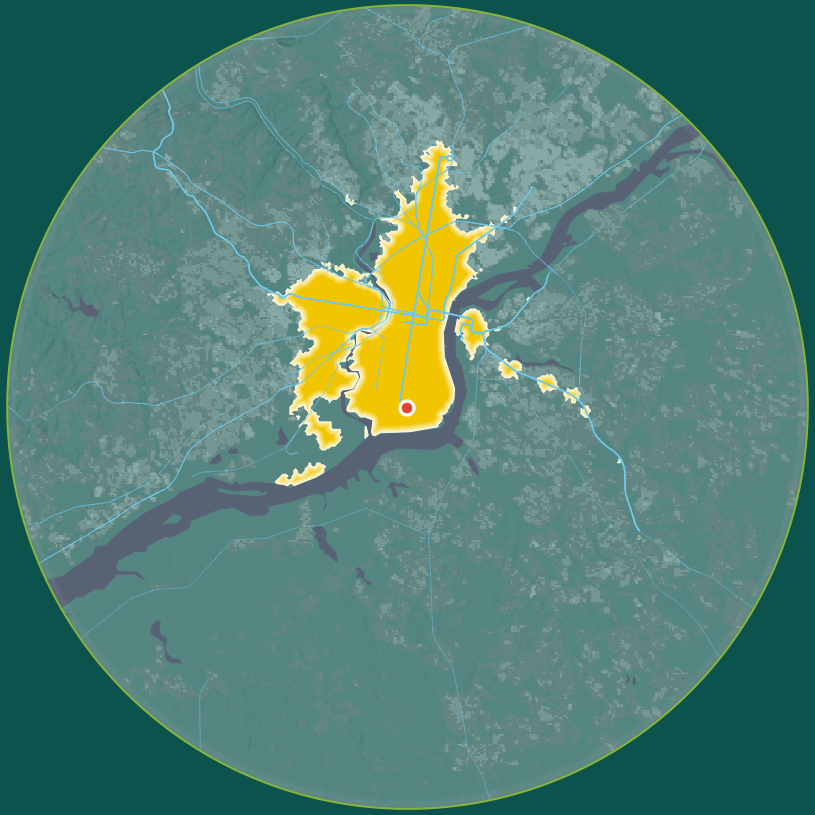
60-minute transit trip
within 25 km
Houston Stadium
(NRG Stadium)
68,777 capacity
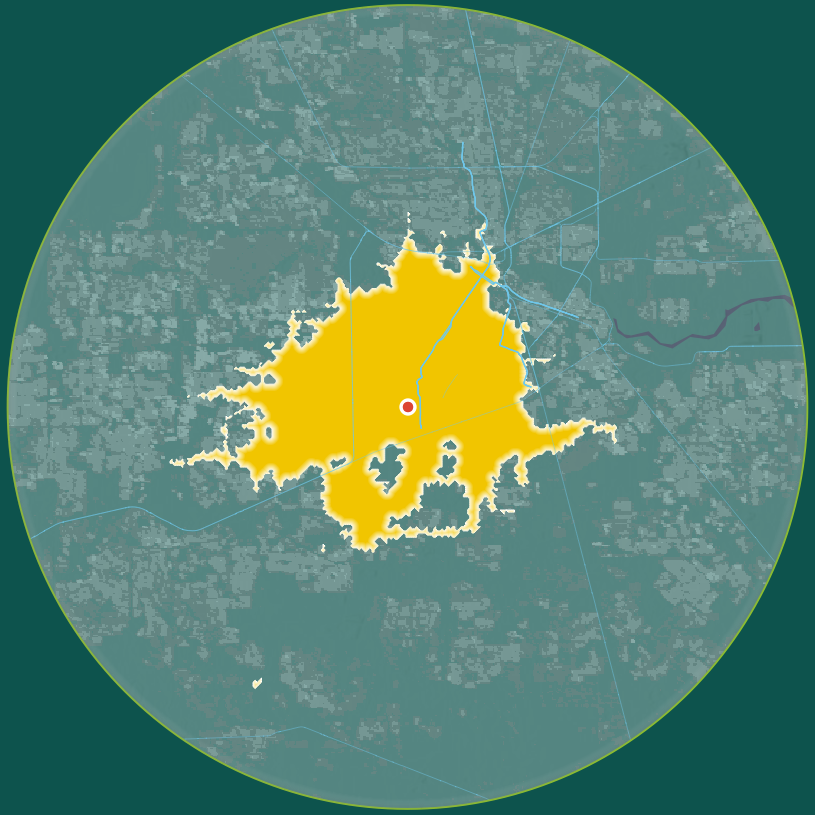
60-minute transit trip
within 25 km
San Francisco Bay Area Stadium
(Levi's Stadium)
68,827 capacity
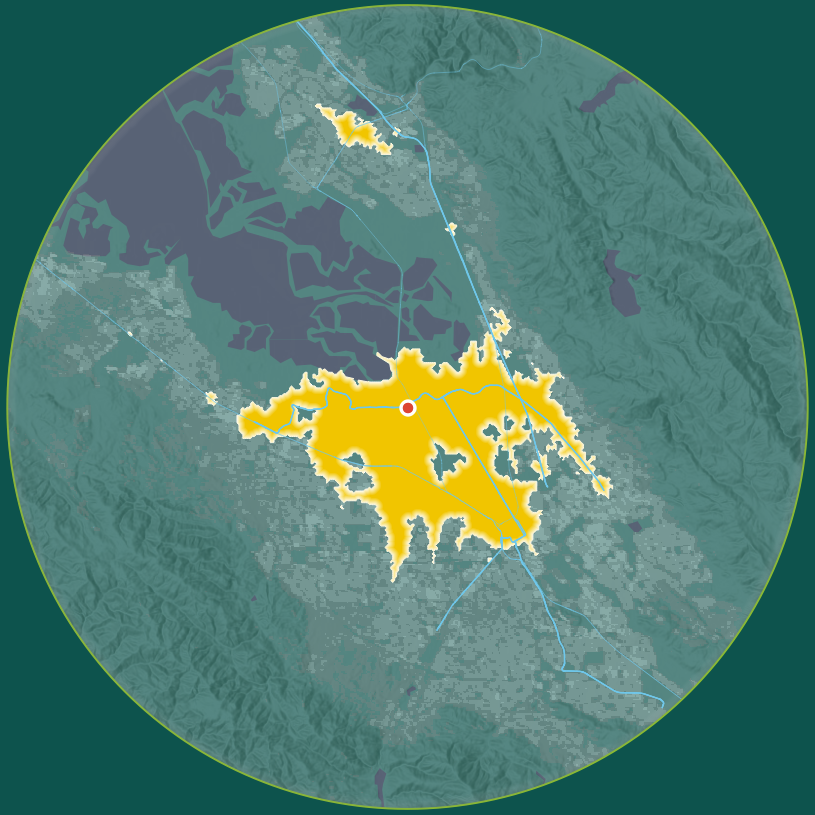
60-minute transit trip
within 25 km
Estadio Guadalajara
(Estadio Akron)
45,664 capacity
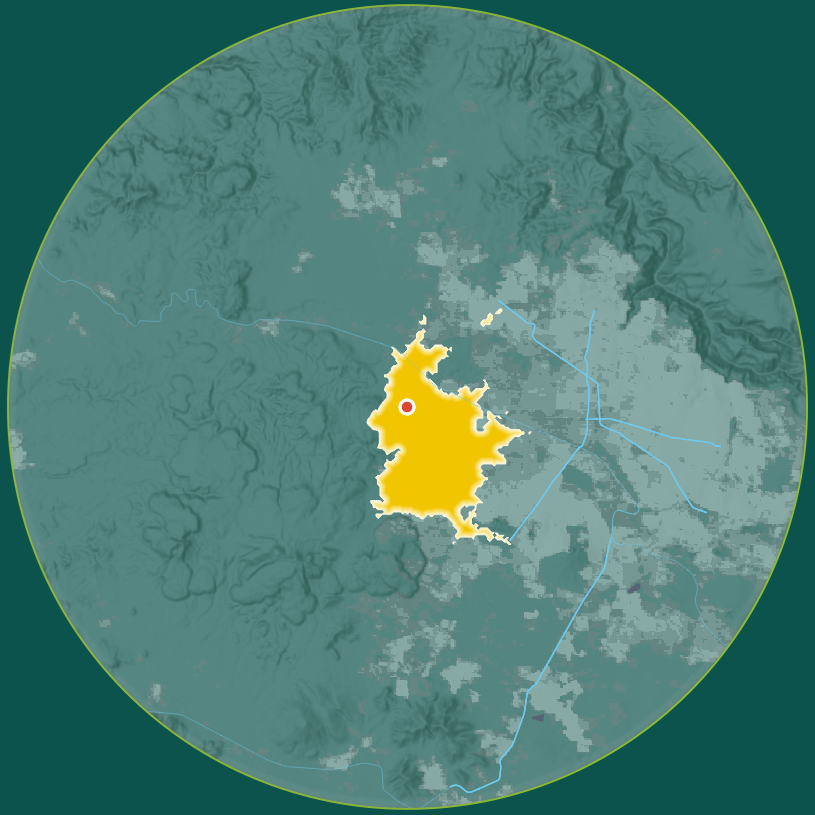
60-minute transit trip
within 25 km
Miami Stadium
(Hard Rock Stadium)
64,478 capacity
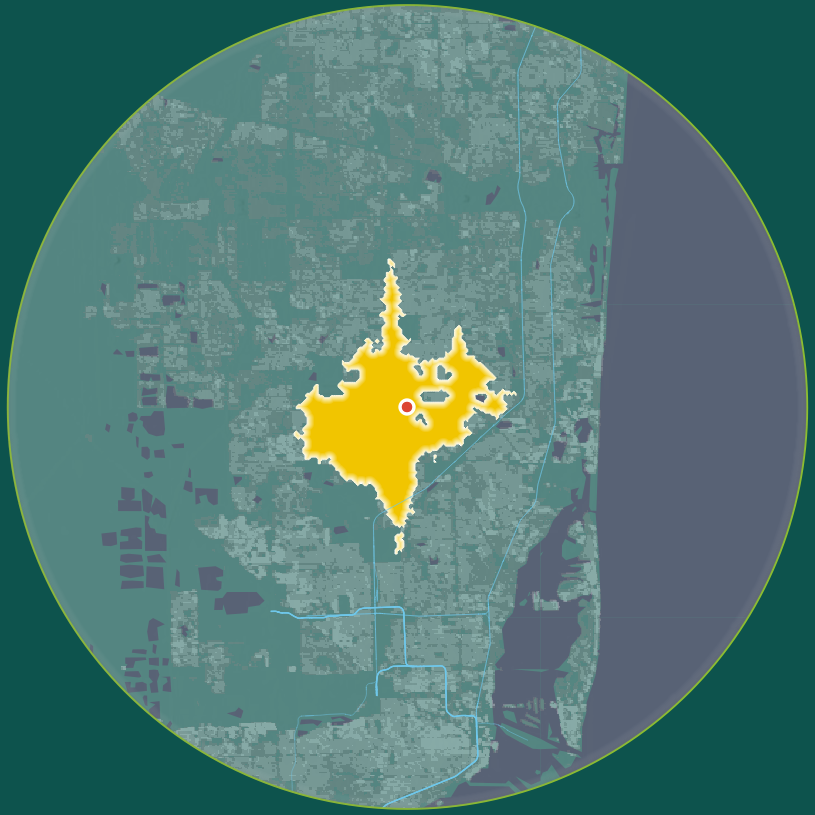
60-minute transit trip
within 25 km
Dallas Stadium
(AT&T Stadium)
70,649 capacity
60-minute transit trip
within 25 km
Kansas City Stadium
(Arrowhead Stadium)
69,045 capacity
60-minute transit trip
within 25 km
Boston Stadium
(Gillette Stadium)
64,146 capacity
60-minute transit trip
within 25 km
Note on Monterrey: Estadio BBVA (Guadalupe, NL) is not included in this analysis as we were unable to find GTFS for transit agencies in the region.
Data & Methods
In brief, we ...
- Built multi-modal (transit + walk) routing networks for each metro area.
- Used these networks to generate 60-minute isochrones around each stadium.
- Overlaid the isochrones with population data to estimate the total number and share of metro residents within each catchment.
The following goes into detail for each step, as well as summarizes limitations in the data and methods.
Transit networks
We built routing networks using r5r, an R package that allows for large scale multimodal network analysis. For each stadium, we assembled the relevant OpenStreetMap street network (downloaded by state or province as PBF files from Geofabrik and clipped to each stadium's 50 km buffer) alongside all available GTFS feeds for transit agencies serving the region. We sourced GTFS feeds from transit agency open-data portals, MobilityDatabase, and Transitland. For smaller routes where no published feed existed, we constructed feeds manually from publicly available route and schedule data (for example, a planned event shuttle network in Arlington (Dallas Stadium), and the recently opening SITEUR Mi Macro Línea 5 in Guadalajara). The result is a network dataset that can be used for routing and travel time estimates that account for walking to/from stops, waiting for a transit vehicle, in-vehicle travel times, and any transferring between vehicles necessary.
Isochrones
We computed transit isochrones for each stadium at 15, 30, 45, and 60-minute travel time thresholds. These travel times account for walking to/from stops, waiting for a transit vehicle, in-vehicle travel time, and any transferring between routes. We used a departure time of 5 p.m. local time on Tuesday, June 9, 2026. This is approximately representative of a weekday evening during the tournament's group stage. To account for uncertainty in exactly when someone might leave, we sampled departures across a 120-minute window centred on that time and used the 33rd-percentile travel time within this window. This reflects what most fans with a rough sense of the schedule could reliably achieve, rather than an optimistic best-case trip where you arrive at the stop just as a vehicle departs. We set walk speed to 4.5 km/h with a maximum walking time of 60 minutes (i.e. if there is no public transit present, then the map would result in a 60-minute walking isochrone).
Population
We estimated population within each isochrone by summing WorldPop R2025A (2025 estimates, 100m resolution) raster cells that fall within the 60-minute transit isochrone polygon. We derived metro-level population denominators used to calculate the percentage of the metro population reachable from 25 km buffers around each stadium, also intersected with the WorldPop grid. All spatial operations used area-equidistant projections centred on each stadium to minimize distortion in distance and area measurements.
Limitations
These results reflect a simulated departure window of 5–7 p.m. local time on a single Tuesday in June 2026. Outcomes could differ significantly for morning kick-offs, weekend matches, or cities where evening transit frequency drops sharply after the peak hour.
Our routing model assumes all access to transit is on foot. In practice, people also cycle, drive to park-and-ride facilities, or use taxi and rideshare drop-offs at stations. Each of these could extend the effective catchment area. We sourced pedestrian networks from OpenStreetMap, which may not fully represent all walkable paths. Missing footpaths or crossings can cause the routing engine to underestimate walkable access to transit stops. These factors may underestimate the size of isochrones.
Our analysis does not account for financial cost, physical accessibility, or other barriers to public transit use. A person may live within a 60-minute transit isochrone and still face obstacles (e.g. unaffordable fares, inaccessible stations, language barriers, or wayfinding difficulties) that may increase travel times or cause someone to not take public transit at all. Therefore, treat the reachable population figures as an upper bound on who could use public transit, not who potentially would.
Similarly, travel time estimations are based on published schedules, but does not account for real-world delays. For example, buses or trams in mixed traffic are often slowed by traffic congestion, meaning actual travel times could exceed our estimates (especially shortly after events).
We did try to include event service enhancements (e.g. trains serving MetLife Stadium, or the planned shuttle network in Arlington), but some services may have been missed and any very recent changes announced after we built the networks would not be reflected. GTFS feed coverage also varies by city, and some smaller or informal transit operators may not be represented.
Population figures are modeled estimates for 2025 rather than census counts which occur at different years in each country. We approximated metro boundaries using fixed-radius buffers rather than official metropolitan area definitions. The 25 km buffer was selected for consistency (since metro area boundaries can vary substantially in what is considered as part of the metro area). But using a 25 km buffer arguably would under-count the metro population when a stadium sits near the edge or outside the urban core. For example, Boston Stadium (Gillette Stadium) is located in Foxborough, roughly 40 km south of downtown Boston, so most of the Boston metro falls outside the buffer. Similarly, Estadio Azteca sits on the southern edge of Mexico City, meaning a substantial portion of the urban area's roughly 23 million residents live beyond the 25 km radius.
We assigned population to isochrone polygons using areal interpolation, which assumes population is distributed uniformly within each 100 metre cell. This may over- or under-count in areas where the isochrone edge cuts through zones with uneven population density such as parks, industrial or commercial areas, or grid cells that contain rivers or water bodies.