
Visitor Activity Across Soccer Matches in Toronto and Vancouver
The recent soccer matches invited a largely local audience for a global event
Canada recently co-hosted the FIFA World Cup 2026 for the first time – to much fanfare and trepidation. Both host cities upgraded or renovated their stadiums, Toronto invested in transit infrastructure, and Vancouver expanded pedestrian zones.
In the end, what was the visitor impact on the cities and during the matches? We looked at visitor activity during the six matches in Toronto and seven matches in Vancouver – how many people came to each stadium area and city, how visitor traffic in the catchment areas compared to one year previous, and where visitors came from. Due to data limitations, we were only able to identify visitors who had travelled from across Canada and the United States.
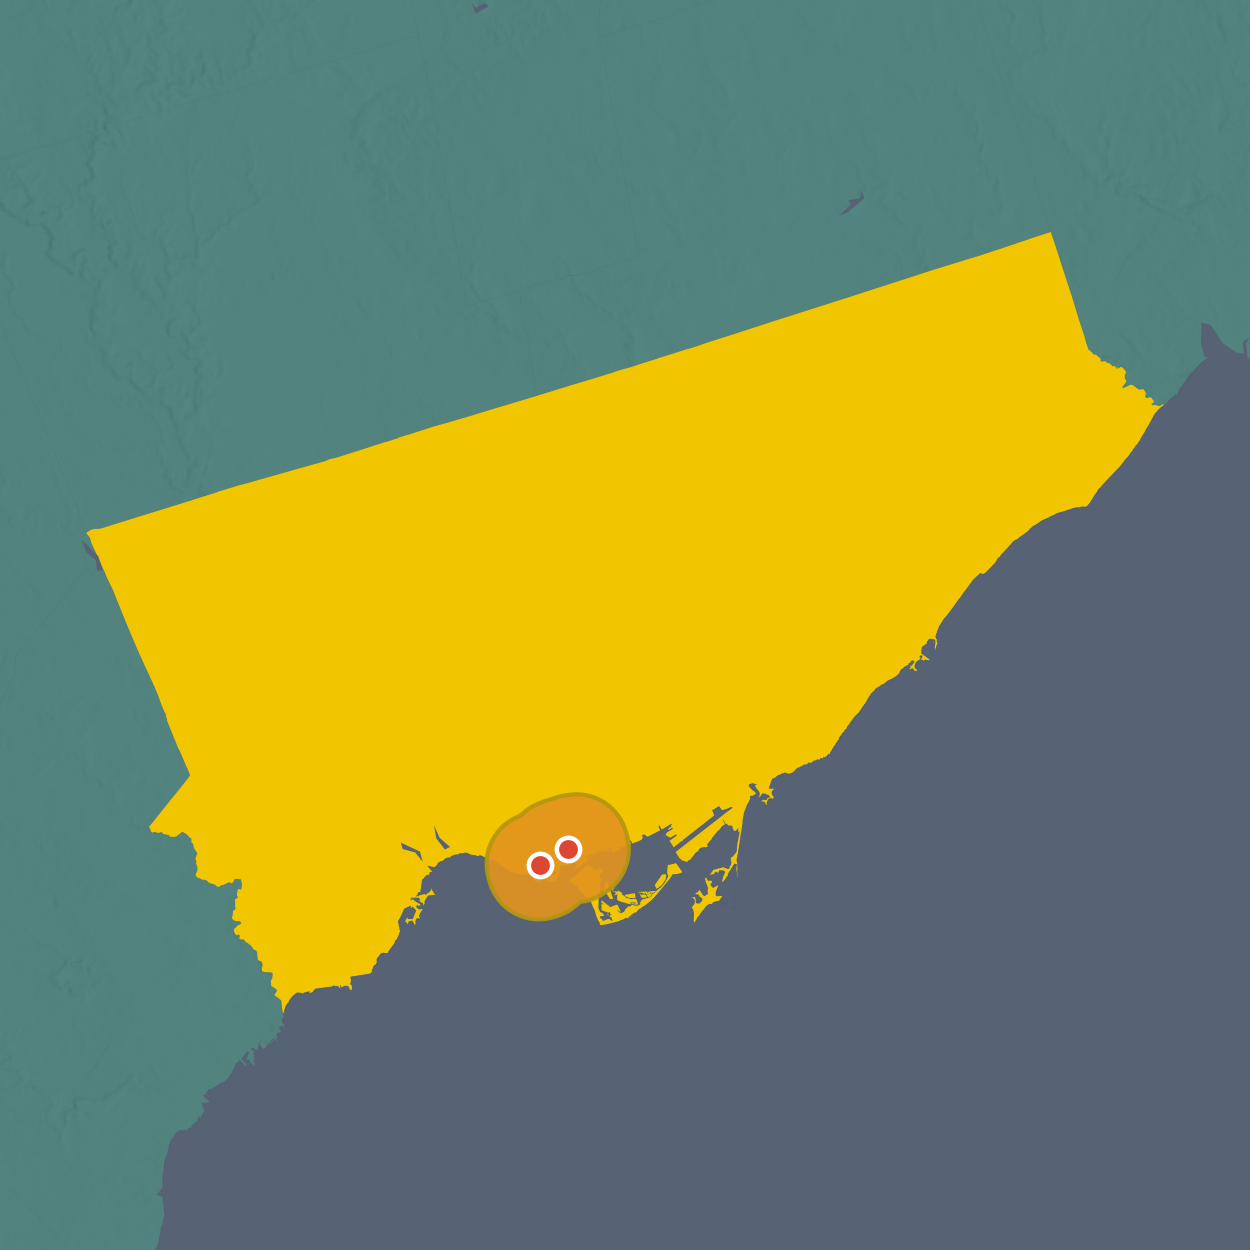
We drew two catchment areas for visitors: a two-kilometre zone around the stadiums and fan zones as well as the full municipal boundaries of each city. Using mobile activity records, we counted the individuals who fell in these catchments.
Toronto, Ont.
(BMO Field)
Vancouver, B.C.
(BC Place)
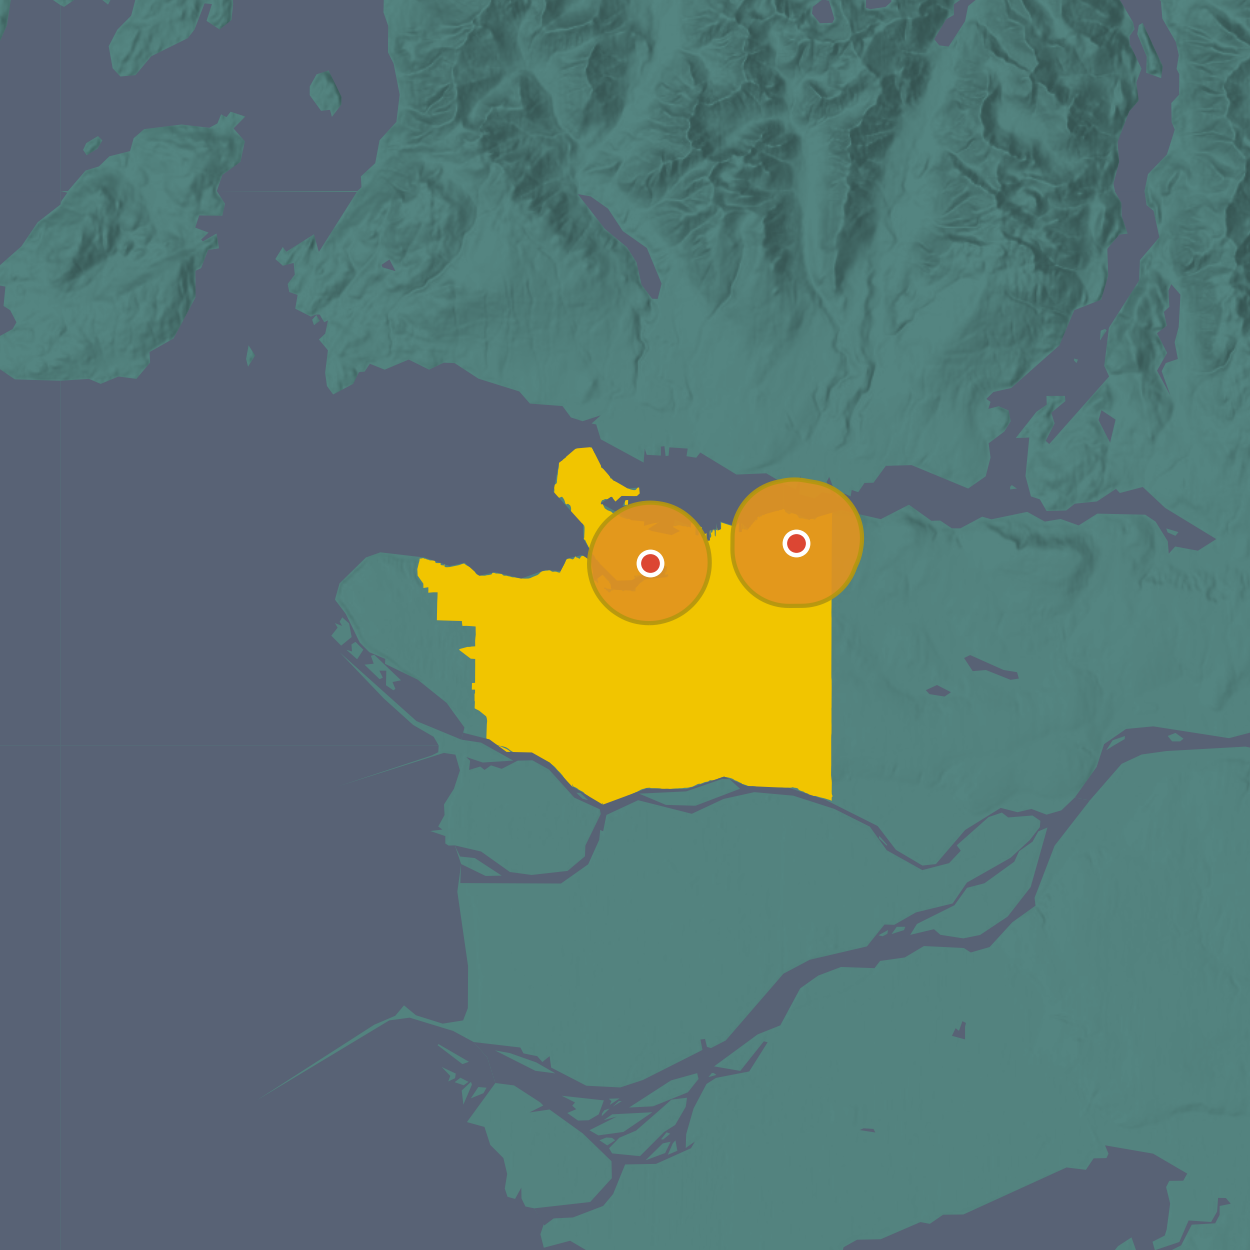
We counted the number of visits to these zones from June 1 to July 10 – encapsulating all soccer matches in both cities – and compared them to approximately five weeks prior and the same date one year ago.
We found that activity was up compared to approximately five weeks prior, but this may be partially a result of the weather warming up. But, when compared to the same date in 2025, we found that activity was approximately the same, and sometimes lower than a year ago, with no noticeable spikes on match days.
Toronto
Within 2km of the stadium & fan zone
Vancouver
Within 2km of the stadium & fan zone
Even if visitation trends did not spike for matches in either city, there were still many visitors on match days in the catchment areas. We also asked – where did they come from, nearby or afar?
Overwhelmingly, visitors on match days were local. They were largely from the host cities themselves, with only a modest number from the metropolitan regions and a trickle from other provinces or the United States. On average, for the two-kilometre radius, just 7.1% of visitors for Toronto's match days were from outside the city, and 9.9% for Vancouver, with similar numbers for the whole city.
Some of this dominance is to be expected: Toronto and Vancouver are the largest cities in their regions. Still, the surrounding municipalities showed up in far fewer numbers than their share of the regional population might suggest.
Matches in Toronto
Greater Toronto and Hamilton Area
Canada and U.S.
Matches in Vancouver
Metro Vancouver
Canada and U.S.
So it appears that, in Toronto and Vancouver, the impact of hosting the global event was largely a local one.
Data & Methods
Mobile activity data
We used anonymized mobile activity data provided by Cuebiq, which processes a sample of location records collected by mobility data providers. Because the data represent only a subset of opted-in mobile devices and include privacy-preserving noise, the results should be interpreted as broad patterns rather than precise counts of individuals.
We examined three 40-day periods, with two comparison periods to distinguish activity related to the tournament:
- FIFA World Cup 2026 period: June 1 to July 10, 2026
- Five-week baseline: April 22 to May 31, 2026
- Previous-year baseline: June 1 to July 10, 2025
Areas of interest
We measured activity in two types of areas to capture venue visitors and the surrounding areas. The first consisted of two-kilometre buffers around the match stadium and official fan zone in each host city.
We tested several alternative buffer sizes – 100 metres, 200 metres, 500 metres, 1 kilometre, 2 kilometres, 5 kilometres, and 10 kilometres – and found similar overall patterns. We therefore used the 2-kilometre buffers as a balance between capturing event-related activity and limiting unrelated activity elsewhere in the city.
For a broader comparison, we also measured activity across the full municipal boundaries of Toronto and Vancouver, using Statistics Canada census subdivision (CSD) boundaries.
Activity trends
For each area, we compared daily activity during the hosting period with the corresponding days in the two baseline periods. We initially explored an hourly breakdown of activity, but the available sample was not large enough to support reliable hour-by-hour estimates.
We do not report raw device or visitor counts, to preserve privacy and because the data is a subsample of the population. Instead, the charts show normalized activity values that permit comparison.
Visitor origins
We also examined the estimated home origins of visitors observed within the stadium and fan-zone catchments on match days. Origins were available for Canada, excluding Quebec, and for the United States. Visitors from other countries are therefore not represented, even though international visitors from outside Canada and the United States undoubtedly attended the tournament.
Within Canada, we examined origins at two geographic scales: the Toronto and Vancouver census metropolitan areas (CMA), and Canada’s provinces and territories. The United States was included as a single origin category. This allowed us to distinguish visitors from the host city, the surrounding metropolitan region, other parts of Canada and the United States.
For each origin, we calculated its average percentage of observed visits across match days. These figures describe the composition of recorded visitor activity rather than the total number of individual visitors.
Limitations
Mobile activity data are an incomplete measure of visits. They only capture devices represented in Cuebiq’s sample, and privacy protections introduce additional noise into the data. A recorded device within a catchment also cannot be assumed to represent someone attending a World Cup event.
The consistency of the results across multiple buffer sizes suggests that the broad findings are not driven solely by the precise boundaries selected. Nevertheless, the activity and origin estimates should be understood as approximate indicators of relative patterns, not comprehensive attendance figures.